async-profiler的使用与RocketMQ性能优化案例
1. async-profiler是什么?
async-profiler是一种低开销的Java采样分析器,不会受Safepoint偏差问题的影响。它具有专门为HotSpot设计的API,用于收集堆栈跟踪信息并跟踪内存分配。分析器可以与OpenJDK、Oracle JDK和其他基于HotSpot JVM的Java运行时一起使用。
async-profiler可以跟踪以下类型的事件:
- CPU周期
- 硬件和软件性能计数器,例如缓存丢失、分支丢失、页错误、上下文切换等
- Java堆中的分配
- 内容锁定尝试,包括Java对象监视器和可重入锁
总结接一下就是能够用来对Java项目进行调优通过分析上述的一些指标。从指标中找出项目中可能存在的优化点。
1.1 如何安装
直接从github的�项目地址下载对应的平台的安装包。然后将其解压到目录中即可:
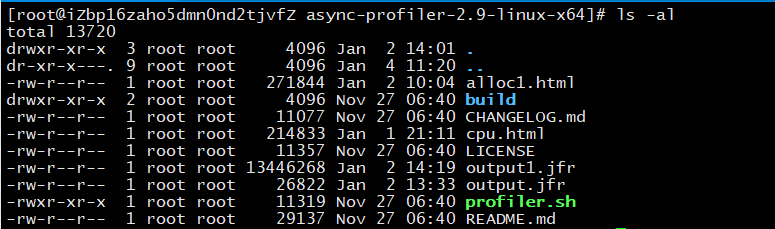
安装的过程即将安装包下载解压即可完成无需复杂的步骤。
1.2 如何使用
用如下命令查看使用帮助:
$ ./profiler.sh -h
Usage: ./profiler.sh [action] [options] <pid>
Actions:
  start             start profiling and return immediately
  resume            resume profiling without resetting collected data
  stop              stop profiling
  dump              dump collected data without stopping profiling session
  check             check if the specified profiling event is available
  status            print profiling status
  meminfo           print profiler memory stats
  list              list profiling events supported by the target JVM
  collect           collect profile for the specified period of time
                    and then stop (default action)
Options:
  -e event          profiling event: cpu|alloc|lock|cache-misses etc.
  -d duration       run profiling for <duration> seconds
  -f filename       dump output to <filename>
  -i interval       sampling interval in nanoseconds
  -j jstackdepth    maximum Java stack depth
  -t                profile different threads separately
  -s                simple class names instead of FQN
  -g                print method signatures
  -a                annotate Java methods
  -l                prepend library names
  -o fmt            output format: flat|traces|collapsed|flamegraph|tree|jfr
  -I include        output only stack traces containing the specified pattern
  -X exclude        exclude stack traces with the specified pattern
  -v, --version     display version string

  --title string    FlameGraph title
  --minwidth pct    skip frames smaller than pct%
  --reverse         generate stack-reversed FlameGraph / Call tree

  --loop time       run profiler in a loop
  --alloc bytes     allocation profiling interval in bytes
  --live            build allocation profile from live objects only
  --lock duration   lock profiling threshold in nanoseconds
  --total           accumulate the total value (time, bytes, etc.)
  --all-user        only include user-mode events
  --sched           group threads by scheduling policy
  --cstack mode     how to traverse C stack: fp|dwarf|lbr|no
  --begin function  begin profiling when function is executed
  --end function    end profiling when function is executed
  --ttsp            time-to-safepoint profiling
  --jfrsync config  synchronize profiler with JFR recording
  --lib path        full path to libasyncProfiler.so in the container
  --fdtransfer      use fdtransfer to serve perf requests
                    from the non-privileged target

<pid> is a numeric process ID of the target JVM
      or 'jps' keyword to find running JVM automatically
      or the application's name as it would appear in the jps tool

Example: ./profiler.sh -d 30 -f profile.html 3456
         ./profiler.sh start -i 999000 jps
         ./profiler.sh stop -o flat jps
         ./profiler.sh -d 5 -e alloc MyAppName
了解了大致如何使用接下来用这个工具来给RocketMQ进行性能优化。
2. async-profiler的使用和RocketMQ性能优化
在使用async-profiler给RocketMQ做性能优化之前我们首先要搭建一套MQ的运行环境:
- 一台机器部署NameServer
- 三台机器部署Controller
- 两台机器部署Broker
- 两台机器用来测试
笔者这里的机器是由他人提供的也主要是用来做RocketMQ的Controller的高可用模式测试的,如果是自己只需要搭建一个最基本的即可。
2.1 内存分配情况与RocketMQ性能优化
这里我主要是对两台Broker的机器内存分配情况做了分析生成了火焰图。具体操作如下:
-
在测试机器启动生产的benchmark里面的
producer.sh脚本$ ./producer.sh -n xxxx(nameServer address:port) -
在两台部署了Broker的机器中任意一台启动内存分配监控生成火焰图,命令如下:
$ ./profiler.sh -d 120 -e alloc -f alloc.html $JVM_PID -
等待步骤2的命令结束生成alloc.html
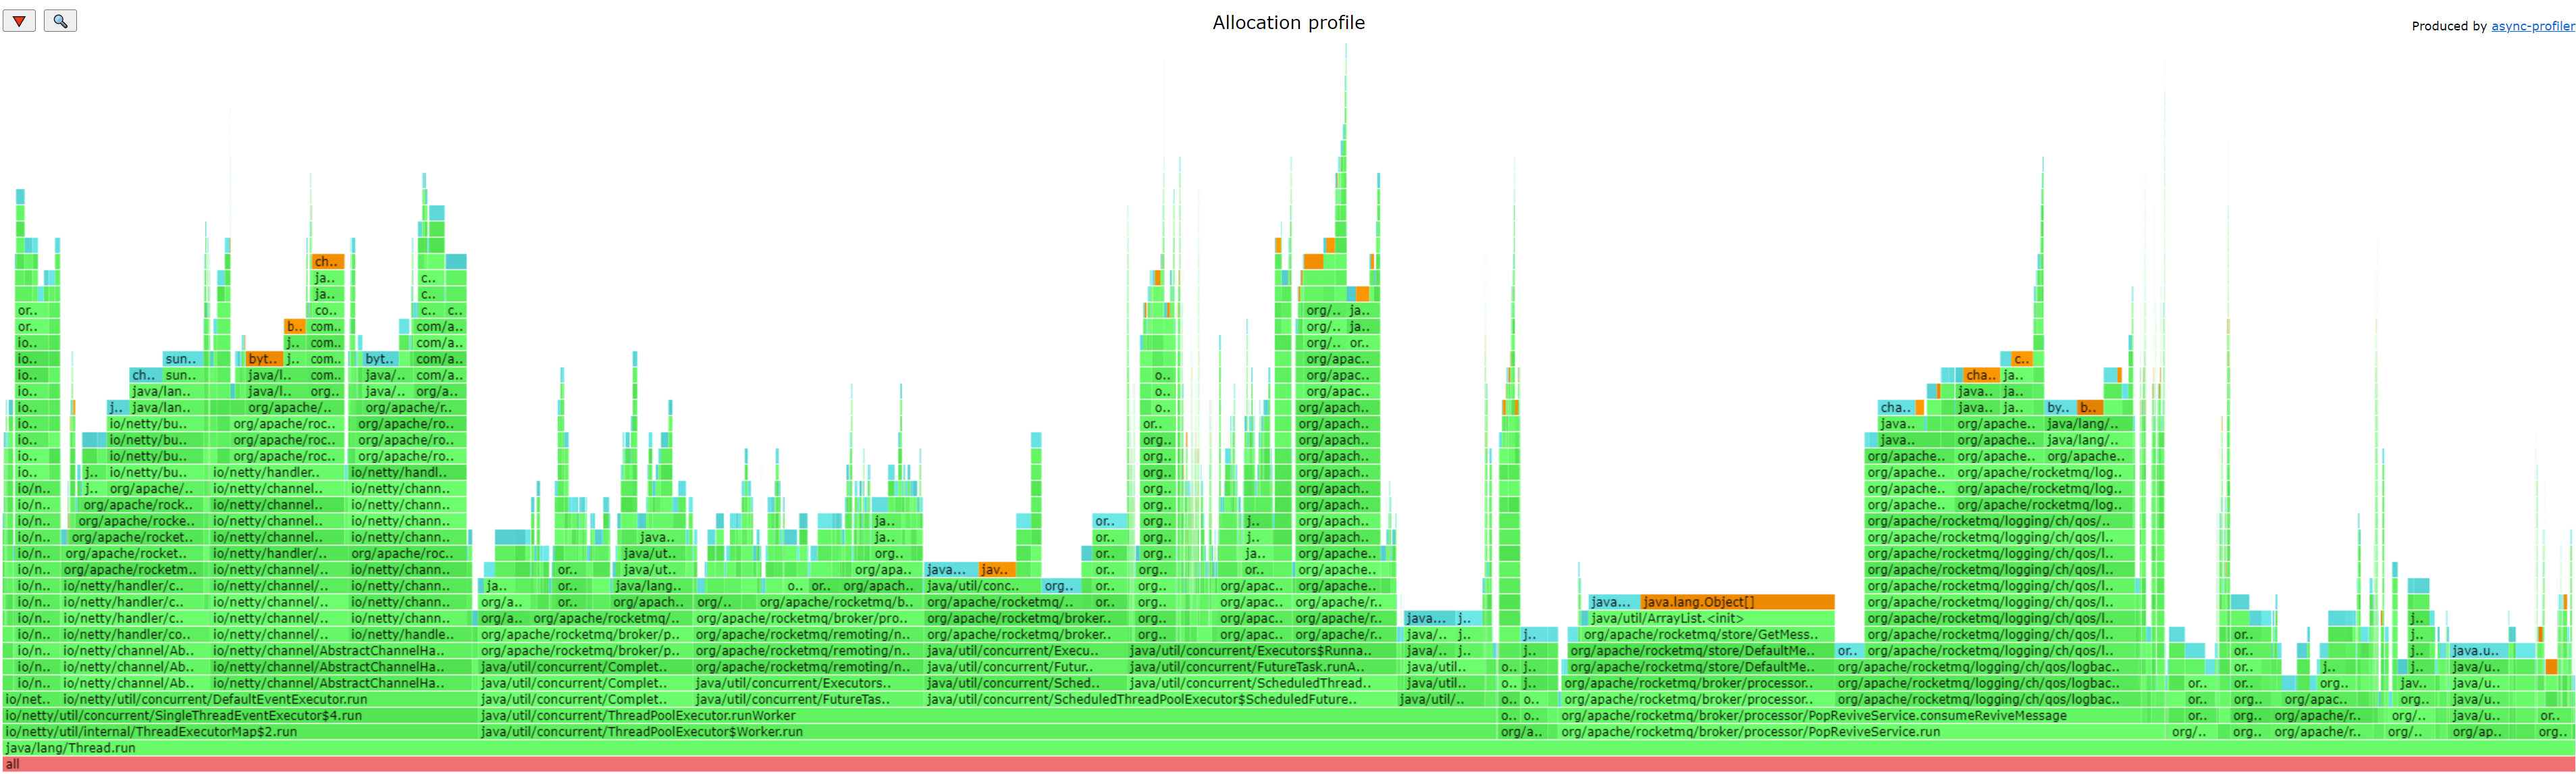
看到这里有人就会想了这个如何去做性能的优化,观察火焰图的顶部如果顶部是平顶说明有大概率存在问题,另外就是根据经验例如:
- 数组的扩容
- HashMap的扩容
- Set的扩容
以上这些都是对性能有很大的影响。根据这些直接搜索:HashMap.resize
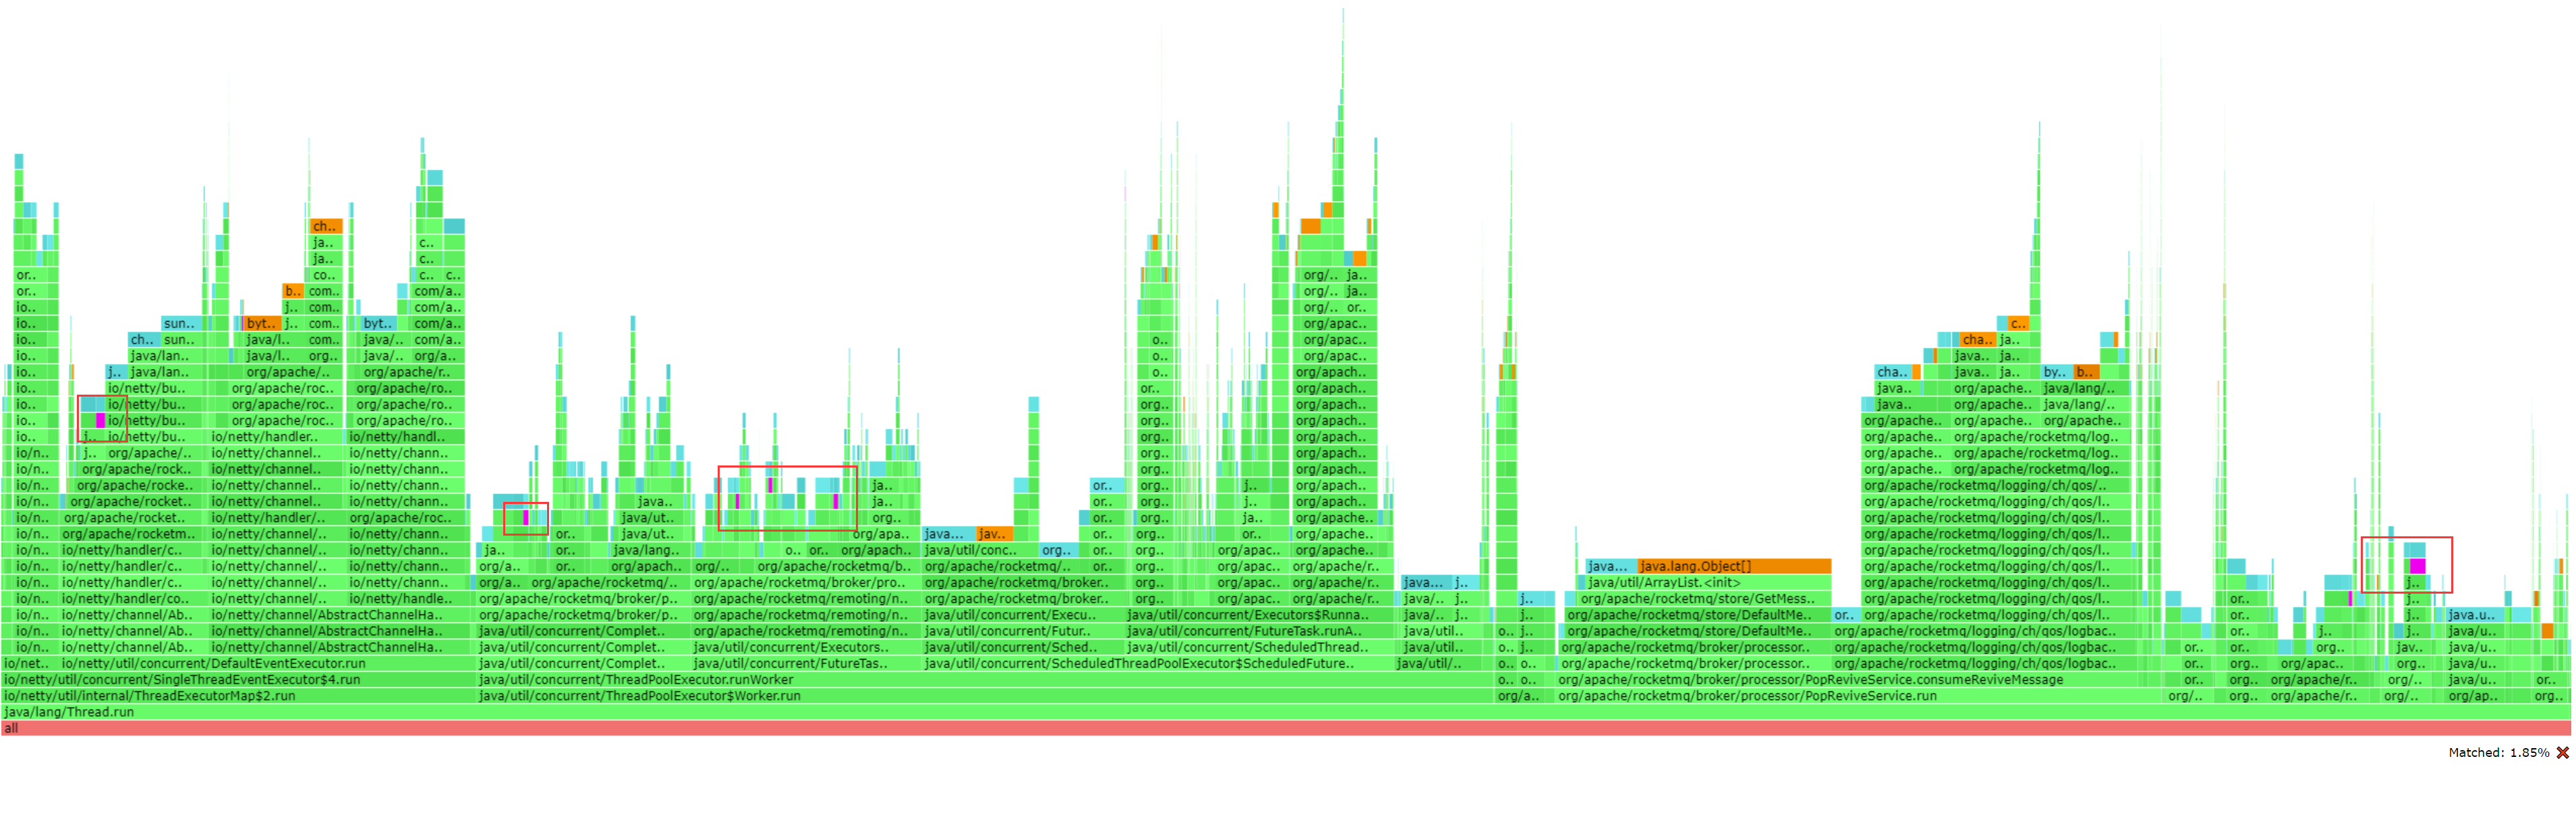
上图中的那些红色被框出来的地方就是调用了扩容的地方。找一处查看验证:

RocketMQ 优化参照 ISSUE-5802以及对应的PR-5803
2.2 锁的监控和RocketMQ锁优化
整体的步骤和上面一样,但是这次是获取lock事件。运行Broker的命令如下:
$ ./profiler.sh -d 120 -e lock -f output.jfr $JVM_PID
生成output.jfr文件,将文件下载到本地用工具打开:
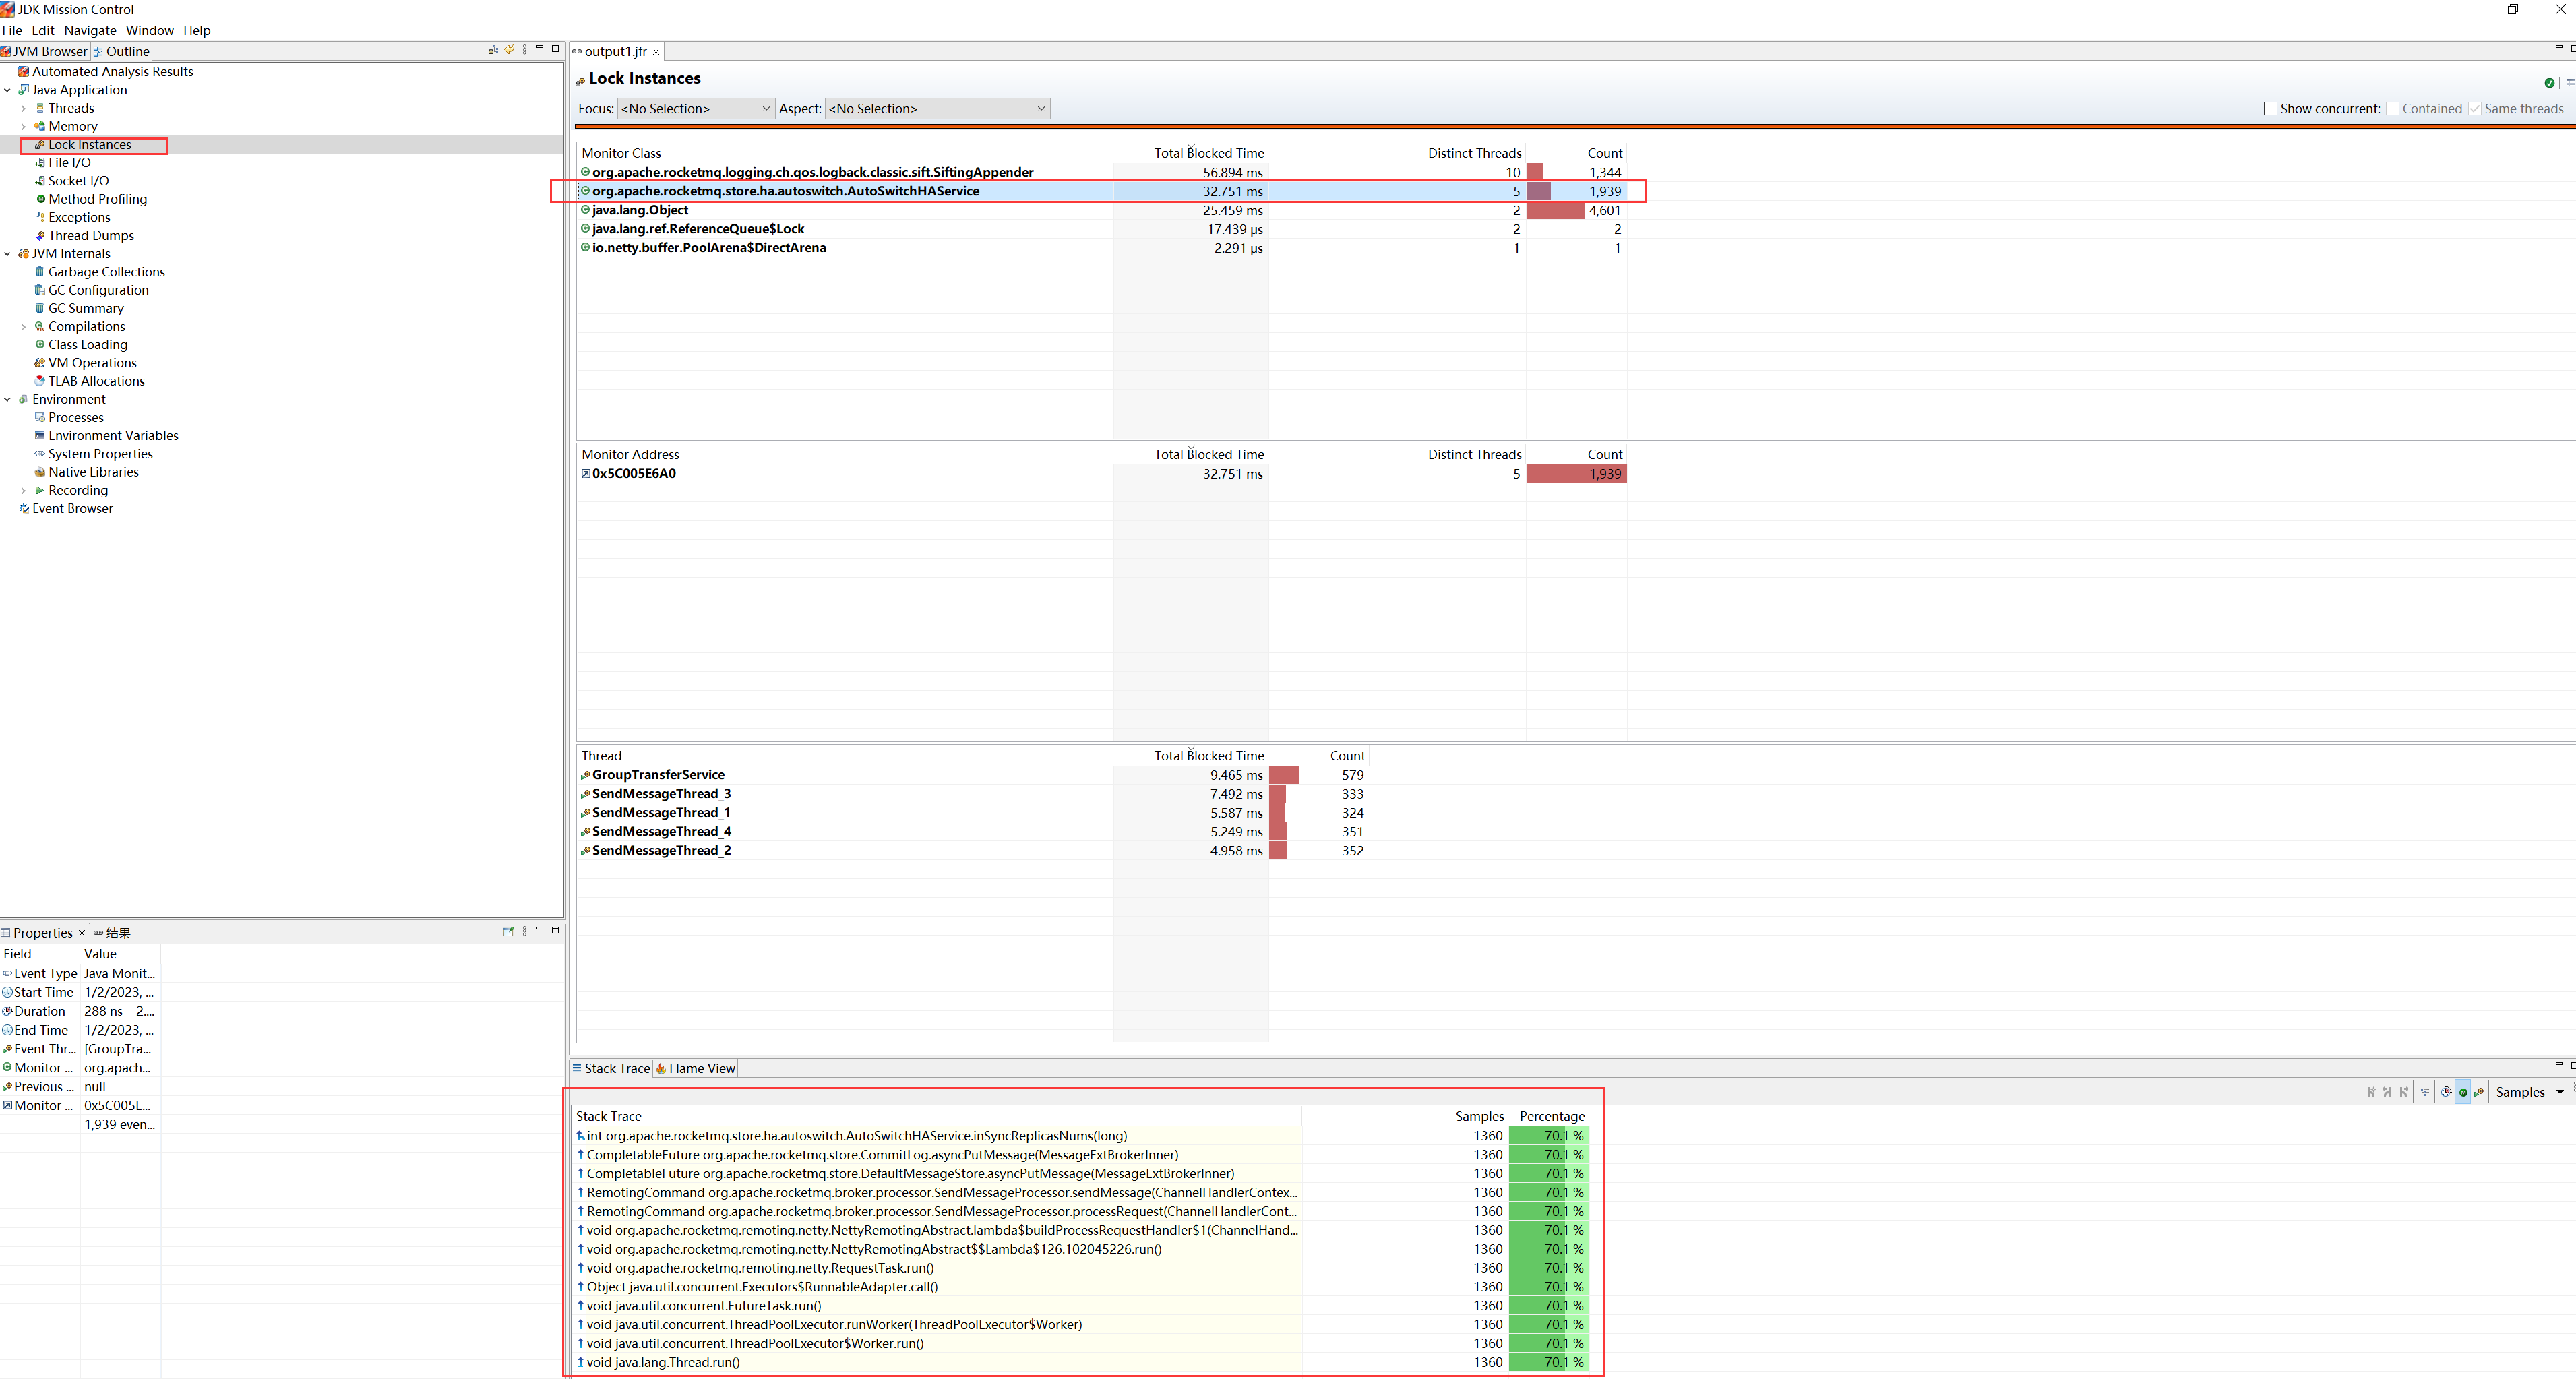
通过使用JMC工具打开找到 Lock Instances 这里发现了一个熟悉的Monitor class: AutoSwitchHAService 。
打开output.jfr笔者使用的是 JDK Mission Control
通过调用堆栈发现是调用 AutoSwitchHAService#inSyncReplicasNums 方法:
    @Override
    public synchronized int inSyncReplicasNums(final long masterPutWhere) {
        return syncStateSet.size();
    }
通过分析可以知道这个方法在高可用的情况下被调用的频率极高,而使用synchronized关键字在**syncStateSet.size()** 多数情况下不会改变性能会相对比较低。(此处为什么需要大家可以执行去研究一下RocketMQ 5最新的Controller模式也就是A-HA模式,笔者这里就不展开讲了)。既然发现了问题那么就针对问题进行解决,解决方案:
使用读写锁来解决这里并发的问题
RocketMQ 优化参照 ISSUE-5809以及对应的PR-5810
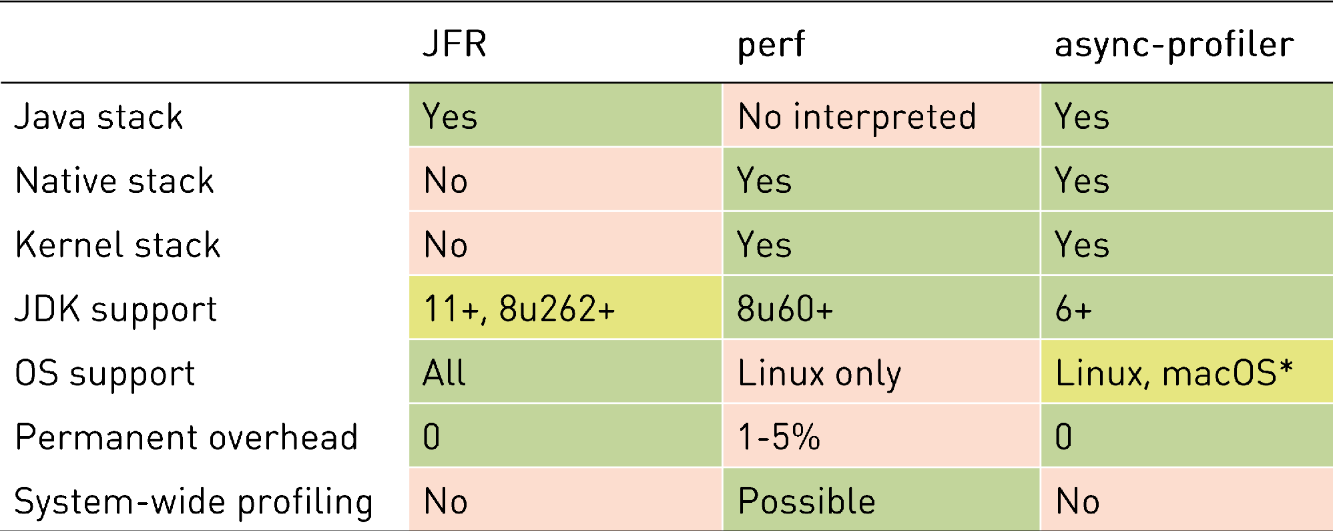
3. 常用工具对比
我是蚂蚁背大象,文章对你有帮助点赞关注我,文章有不正确的地方请您斧正留言评论~谢谢!
参考资料: