Java 性能分析工具 async-profiler
1. async-profiler介绍
Async-profiler是一个低开销的Java采样分析器,不受Safepoint偏差问题的影响。具有特定于Hotspot的API用于收集 堆栈跟踪 和 内存分配 。能够分析 OpenJDK、Oracle JDK 以及其他基于 Hotspot的JVM。
async-profiler能够跟踪一下几种事件:
- CUP cycles
- 硬件和软件性能计数器,如缓存失败、分支失败、页面错误、上下文切换等。
- Java Heap分配
- Contented lock attempts, including both Java object monitors and ReentrantLocks
2. async-profiler安装
在官网提供了不同的平台的下载:
- Linux x64 (glibc): async-profiler-2.8.1-linux-x64.tar.gz
- Linux x64 (musl): async-profiler-2.8.1-linux-musl-x64.tar.gz
- Linux arm64: async-profiler-2.8.1-linux-arm64.tar.gz
- macOS x64/arm64: async-profiler-2.8.1-macos.zip
- 配置文件格式之间的转换器: converter.jar
Tips: 文章编写的时候版本为2.8.1
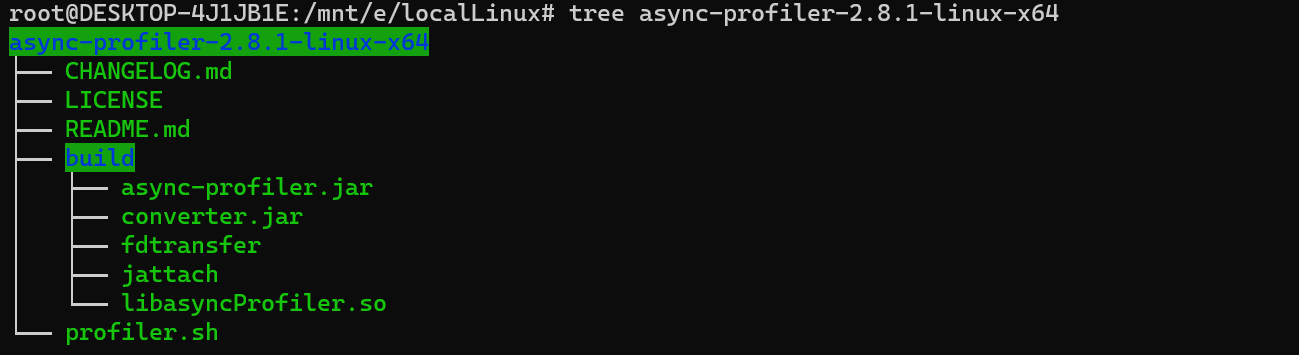
根据自己的平台下载到本地,解压后的目录结构如下:
Tips: 笔者的使用的WSL环境进行测试。
3. async-profiler使用
使用命令:./profiler.sh ,出现如下使用说明。
Usage: ./profiler.sh [action] [options] <pid>
Actions:
  start             start profiling and return immediately
  resume            resume profiling without resetting collected data
  stop              stop profiling
  dump              dump collected data without stopping profiling session
  check             check if the specified profiling event is available
  status            print profiling status
  list              list profiling events supported by the target JVM
  collect           collect profile for the specified period of time
                    and then stop (default action)
Options:
  -e event          profiling event: cpu|alloc|lock|cache-misses etc.
  -d duration       run profiling for <duration> seconds
  -f filename       dump output to <filename>
  -i interval       sampling interval in nanoseconds
  -j jstackdepth    maximum Java stack depth
  -t                profile different threads separately
  -s                simple class names instead of FQN
  -g                print method signatures
  -a                annotate Java methods
  -l                prepend library names
  -o fmt            output format: flat|traces|collapsed|flamegraph|tree|jfr
  -I include        output only stack traces containing the specified pattern
  -X exclude        exclude stack traces with the specified pattern
  -v, --version     display version string

  --title string    FlameGraph title
  --minwidth pct    skip frames smaller than pct%
  --reverse         generate stack-reversed FlameGraph / Call tree

  --loop time       run profiler in a loop
  --alloc bytes     allocation profiling interval in bytes
  --lock duration   lock profiling threshold in nanoseconds
  --total           accumulate the total value (time, bytes, etc.)
  --all-user        only include user-mode events
  --sched           group threads by scheduling policy
  --cstack mode     how to traverse C stack: fp|dwarf|lbr|no
  --begin function  begin profiling when function is executed
  --end function    end profiling when function is executed
  --ttsp            time-to-safepoint profiling
  --jfrsync config  synchronize profiler with JFR recording
  --lib path        full path to libasyncProfiler.so in the container
  --fdtransfer      use fdtransfer to serve perf requests
                    from the non-privileged target

<pid> is a numeric process ID of the target JVM
      or 'jps' keyword to find running JVM automatically
      or the application's name as it would appear in the jps tool

Example: ./profiler.sh -d 30 -f profile.html 3456
         ./profiler.sh start -i 999000 jps
         ./profiler.sh stop -o flat jps
         ./profiler.sh -d 5 -e alloc MyAppName
4. async-profiler使用案例
4.1 案例1
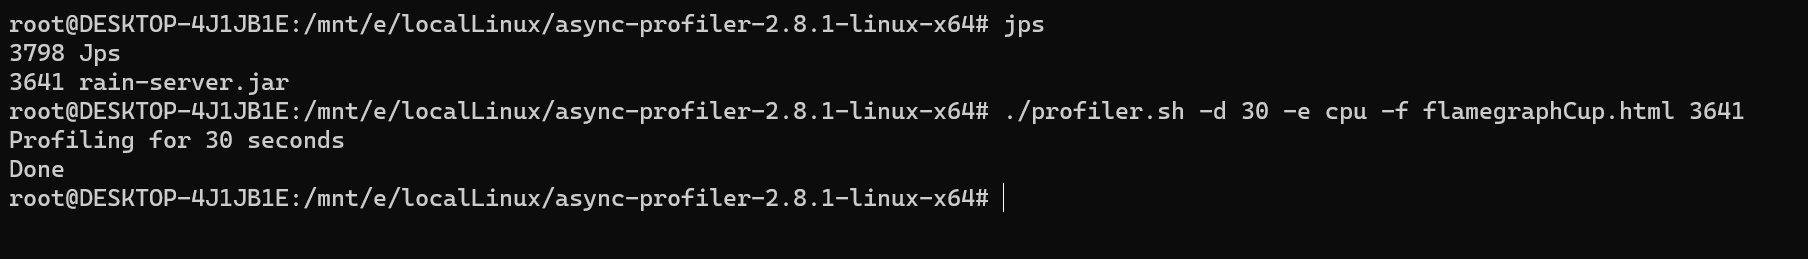
启动一个自己编写的服务。
然后启动jmeter去调用接口,然后启动async-profiler生成cup的火焰图:
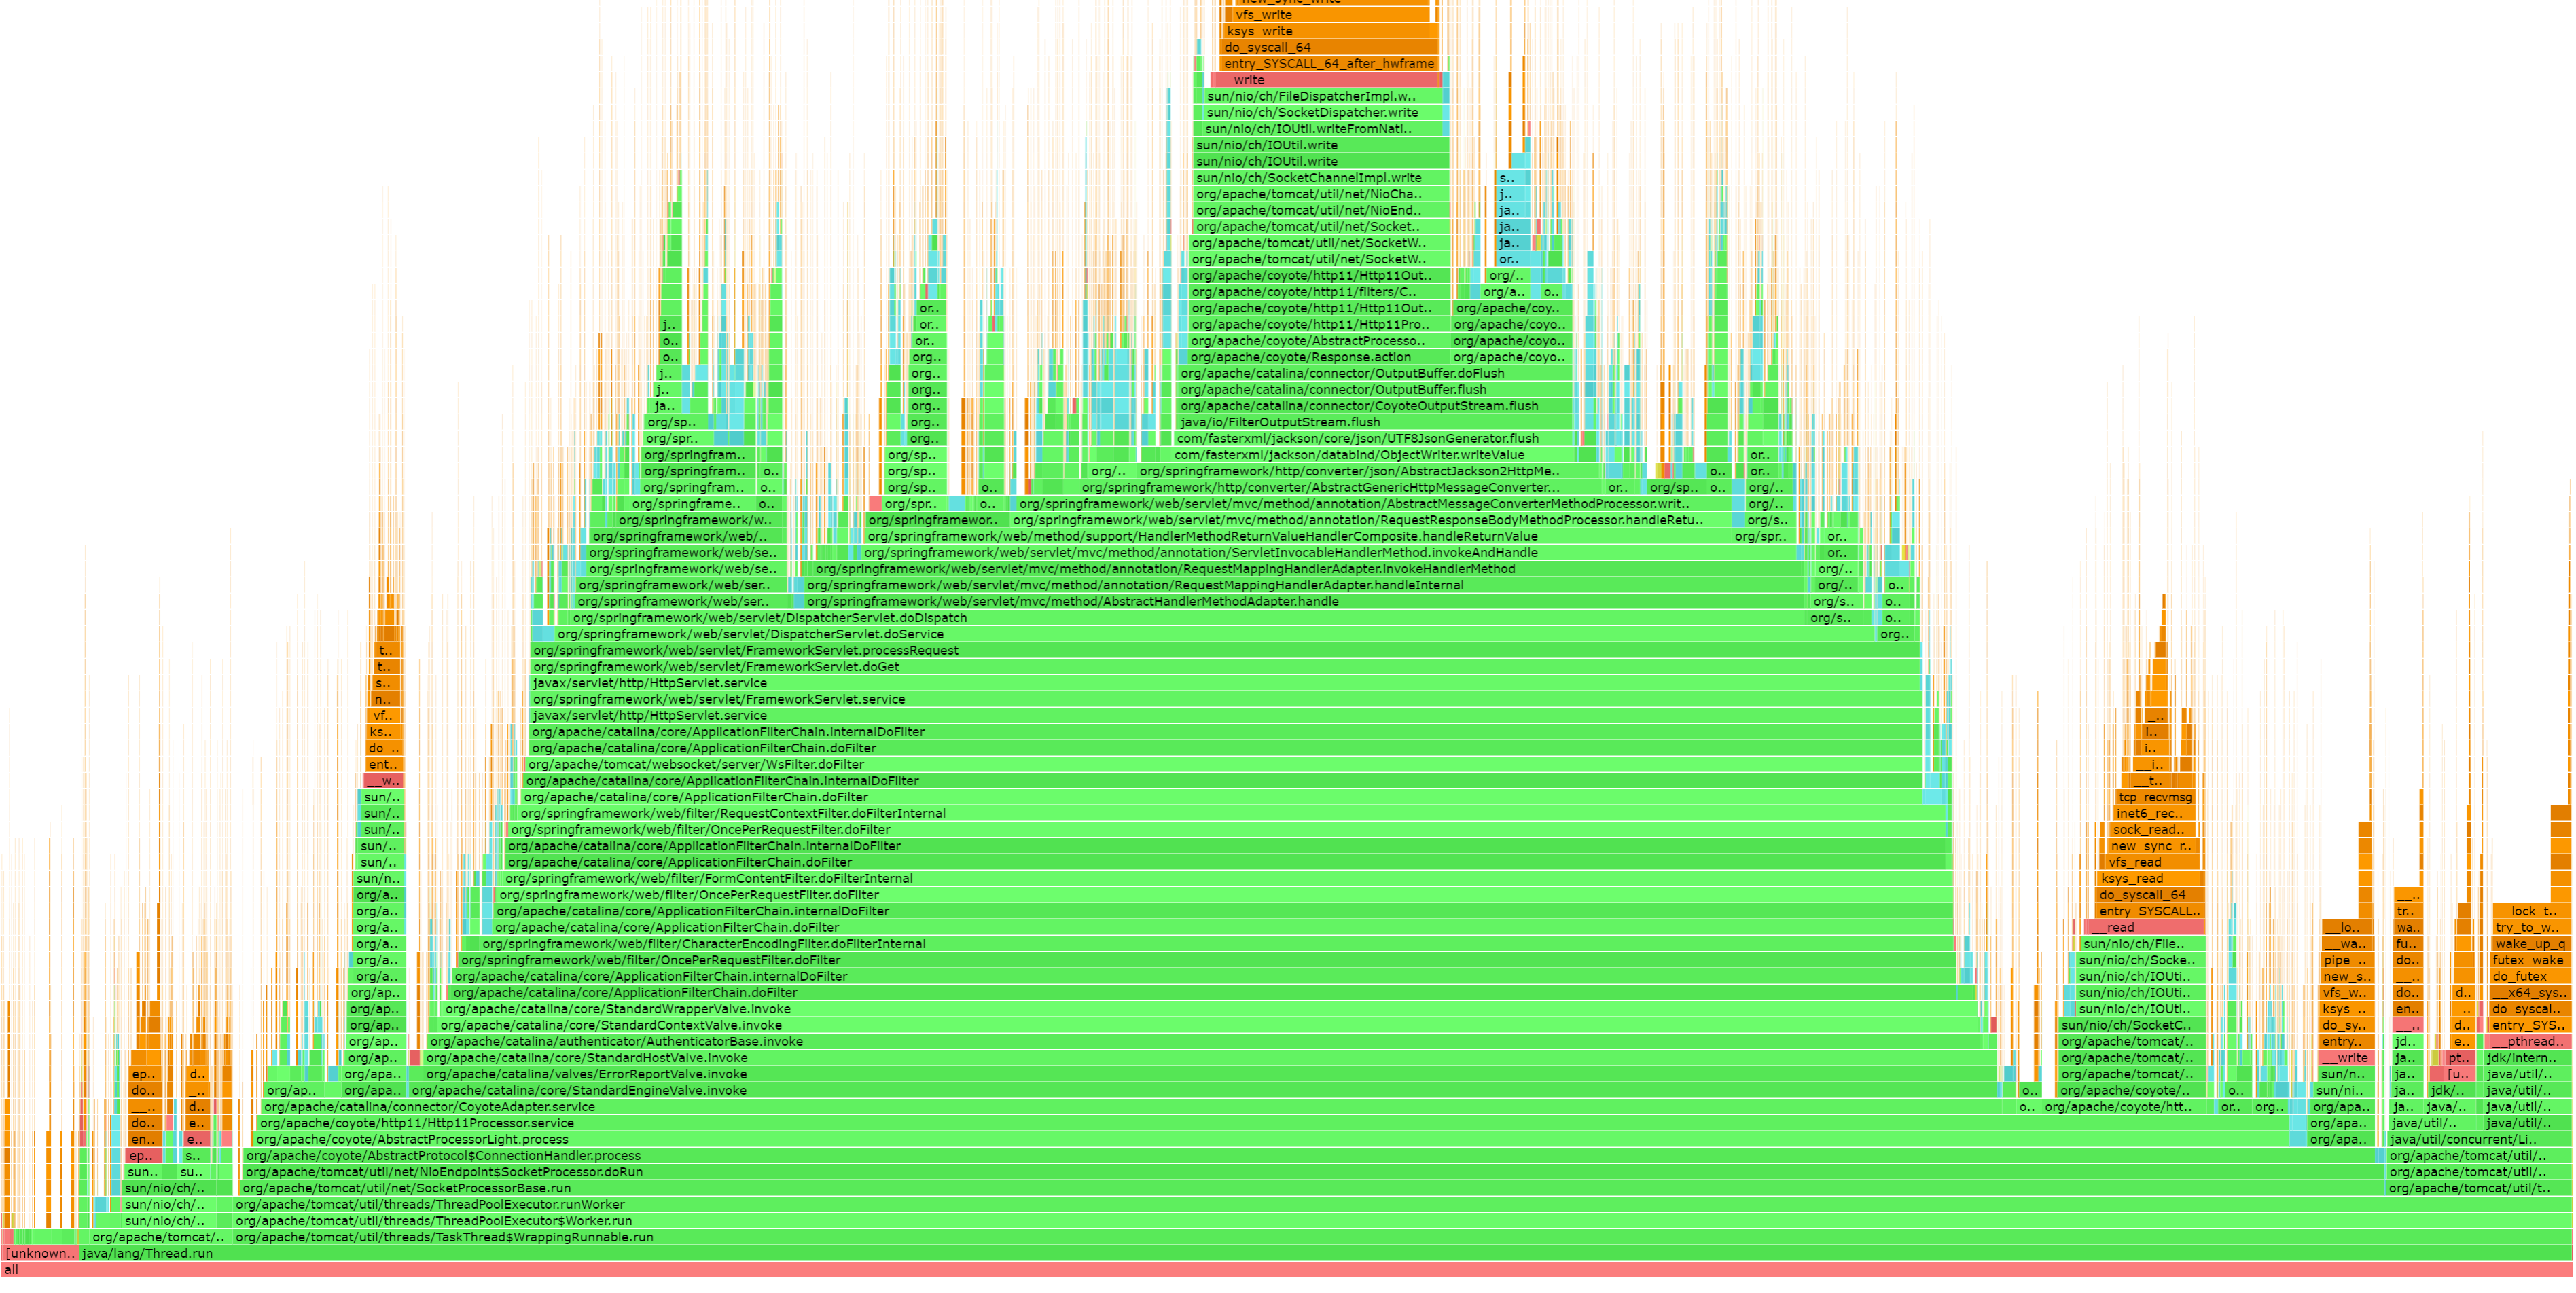
查看火焰图:
4.2 案例2
public class Test {

    public static ExecutorService service = Executors.newFixedThreadPool(10);

    public static void main(String[] args) {

        service.submit(new Runnable() {
            @Override
            public void run() {
                while (true){
                    uuid1();
                    uuid2();
                }
            }
        });
    }

    public  static void uuid1(){
        String s = UUID.randomUUID().toString();

    }

    public static void uuid2(){
        String s = new UUID(ThreadLocalRandom.current().nextLong(), ThreadLocalRandom.current().nextLong()).toString();

    }
}
运行服务:

查看火焰图:
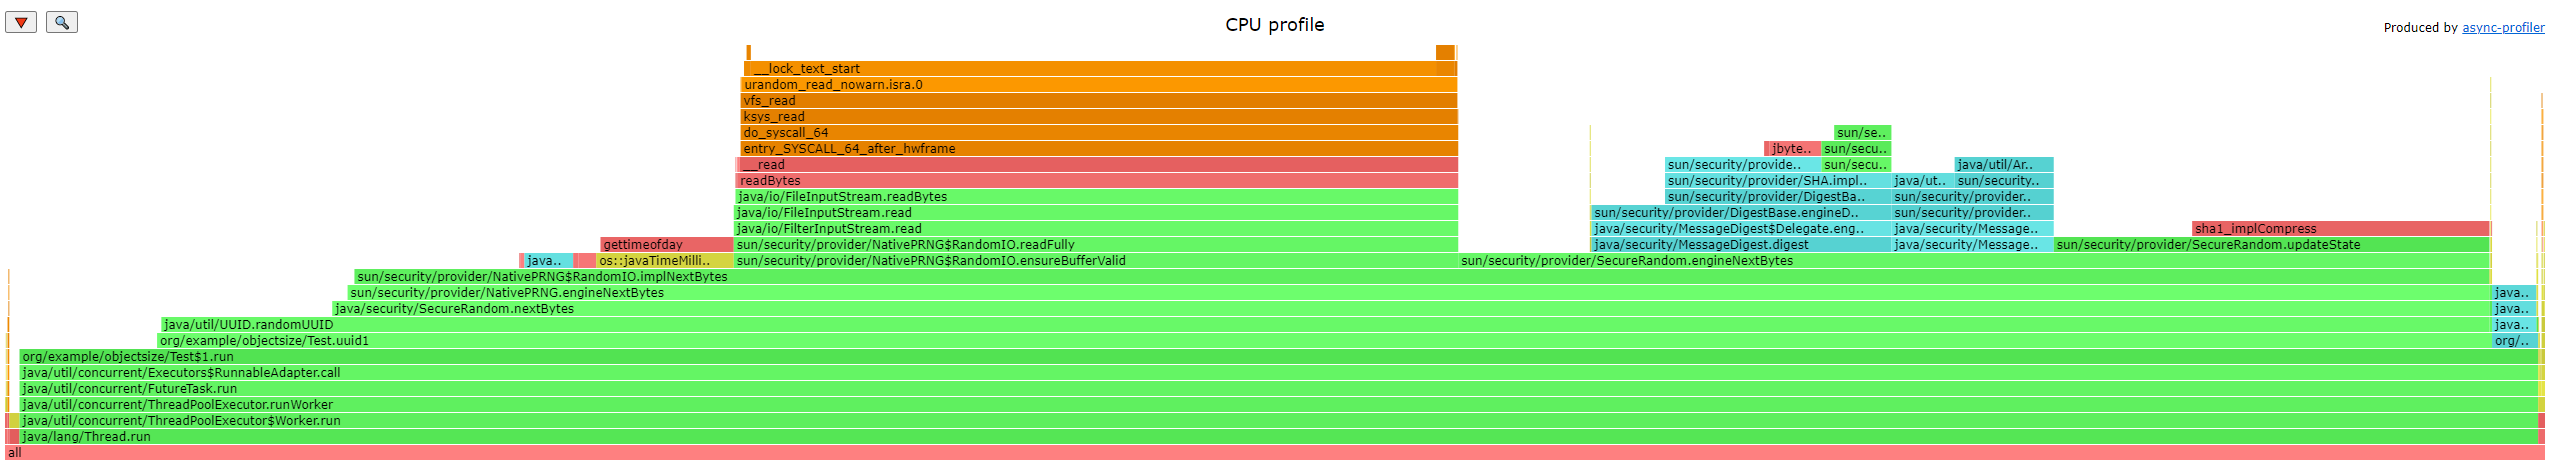
通过分析火焰图会发现 org/example/objectsize/Test.uuid1 和 org/example/objectsize/Test.uuid2 ,uuid1占用的时间远远大于uuid2,说明了 new UUID(ThreadLocalRandom.current().nextLong(), ThreadLocalRandom.current().nextLong()).toString() 的性能高于 UUID.randomUUID().toString() 。
5. 总结
不管是CPU还是内存分配,在火焰图上面横向越长说明越多,纵向表示调用链。火焰图里,横条越长,代表使用的越多,从下到上是调用堆栈信息。在阿里的 arthas也集成了async-profiler。
我是蚂蚁背大象,文章对你有帮助点赞关注我,文章有不正确的地方请您斧正留言评论~谢谢